ACT to SAT Conversion Chart | Compare and Choose Your Test
You took the ACT. Now a college lists its average in SAT scores. Or a friend is comparing, and you have no idea who scored "better." Or you're wondering whether to switch tests entirely before the next application cycle.
ACT to SAT conversion comes up constantly in college prep, and most guides give you the same table without explaining what it actually means. This one does both. You'll get the full concordance chart, a plain-English explanation of how to read it, and the one update from 2025 that most conversion guides have completely missed.
What is the official ACT to SAT conversion?
The ACT to SAT concordance table was developed in a joint study by the College Board and ACT Inc. It works by matching percentile ranks across both tests, not by comparing content. A student who scores in the 85th percentile on the ACT is matched to the SAT score that also falls at the 85th percentile. That's why conversions appear as ranges rather than exact numbers: the two tests measure overlapping but distinct skills, so the match is statistical, not precise.
The College Board makes one thing clear in its published guidance: a concorded score is not a prediction of how you'd actually perform on the other test. It tells you how students at your percentile rank on the ACT compare to students at that same percentile rank on the SAT. That's a meaningful comparison, but it's not the same as taking both tests.
The 2018 concordance tables are the current standard used by both organisations. They remain valid for the Digital SAT (launched in 2024) and the Enhanced ACT (launched in 2025), as confirmed by both test makers.
Full ACT to SAT conversion table
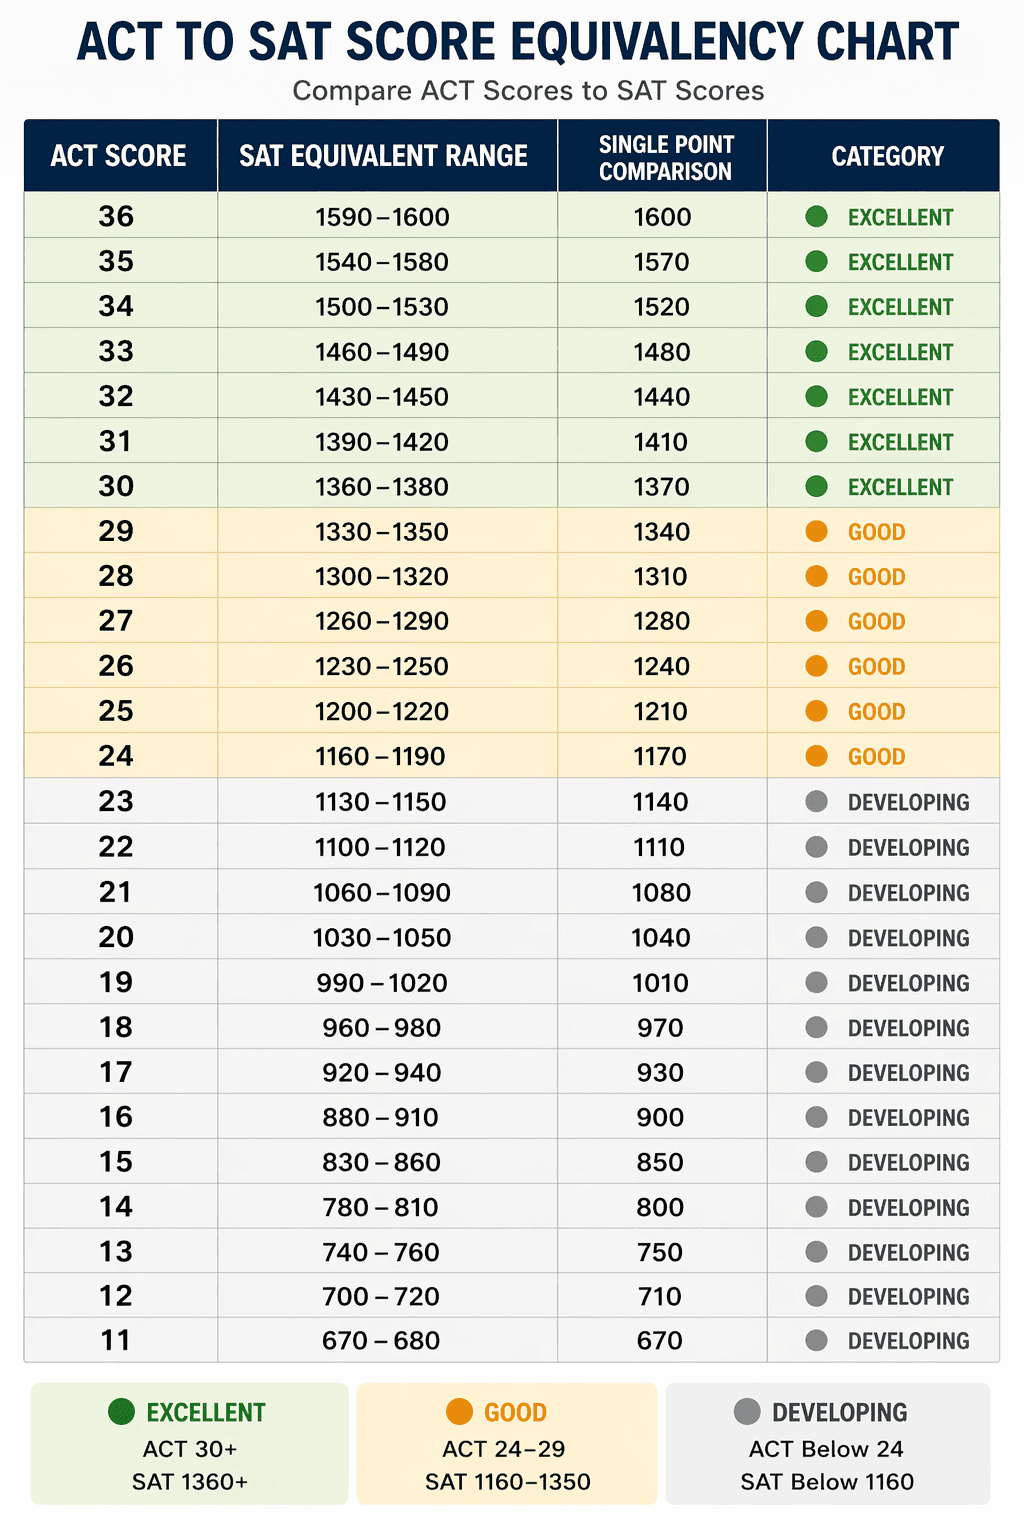
The table below covers every ACT composite score from 11 to 36, with the SAT equivalent range and a plain-language college admissions context. The conversion ranges are based on official College Board and ACT concordance data.
ACT Score | SAT Equivalent | College Context |
|---|---|---|
36 | 1590–1600 | Top 1% nationally; competitive for any school in the country |
35 | 1540–1580 | Strong for Ivy League and T10 schools |
34 | 1500–1530 | Competitive for T20 schools and many Ivy League programs |
33 | 1460–1490 | Strong for top 25–30 schools |
32 | 1430–1450 | Competitive for top 30–50 schools |
31 | 1390–1420 | Above average for most selective schools |
30 | 1360–1380 | Strong for top 100 schools; competitive for many honors programs |
29 | 1330–1350 | Above the national average; solid for selective state schools |
28 | 1300–1320 | Competitive for most four-year universities |
27 | 1260–1290 | Above average nationally |
26 | 1230–1250 | Mid-range for four-year admissions |
25 | 1200–1220 | National average range |
24 | 1160–1190 | Below average for selective schools; fine for most four-year programs |
23 | 1130–1150 | Meets minimum requirements at most four-year schools |
22 | 1100–1120 | Solid for two-year and regional four-year schools |
21 | 1060–1090 | Around the 50th percentile nationally |
20 | 1030–1050 | Below average; worth a retake if targeting selective schools |
19 | 990–1020 | Below national average |
18 | 960–980 | Qualifies for most open-enrollment schools |
17 | 920–940 | Likely needs improvement for four-year admissions |
16 | 880–910 | Below minimum for most four-year schools |
15 | 830–860 | Community college range |
Note: These ranges are based on percentile equivalence, not a one-to-one content match. Individual scores can vary from the concorded range based on your actual test-taking strengths.
In sessions working with students at NAT, the most useful thing you can do with this table is compare your score to the reported middle 50% ranges at your target schools. If a school lists an ACT middle 50% of 30–33, the SAT equivalent is roughly 1360–1490. If your score falls inside that window on either test, you're in the range.
SAT to ACT conversion (reverse chart)
To convert an SAT score to an ACT equivalent, use the same concordance data in reverse. A 1400 SAT equals roughly a 31 ACT; a 1500 SAT equals roughly a 33–34 ACT; a 1550 SAT equals roughly a 34–35 ACT. This matters when a school posts requirements in SAT format and you need to know where your ACT score stands.
One important note from Compass Prep's concordance analysis: section-to-section conversion (SAT Math to ACT Math, for example) is significantly less reliable than composite-to-composite comparison. The sections measure skills in different formats with different question structures. Stick to composite conversions for college planning.
Students who already have an SAT score and need to run the SAT to ACT conversion in the other direction will find the full breakdown there, including how to read your result against specific school requirements.
How does the 2025 Enhanced ACT change your conversion?
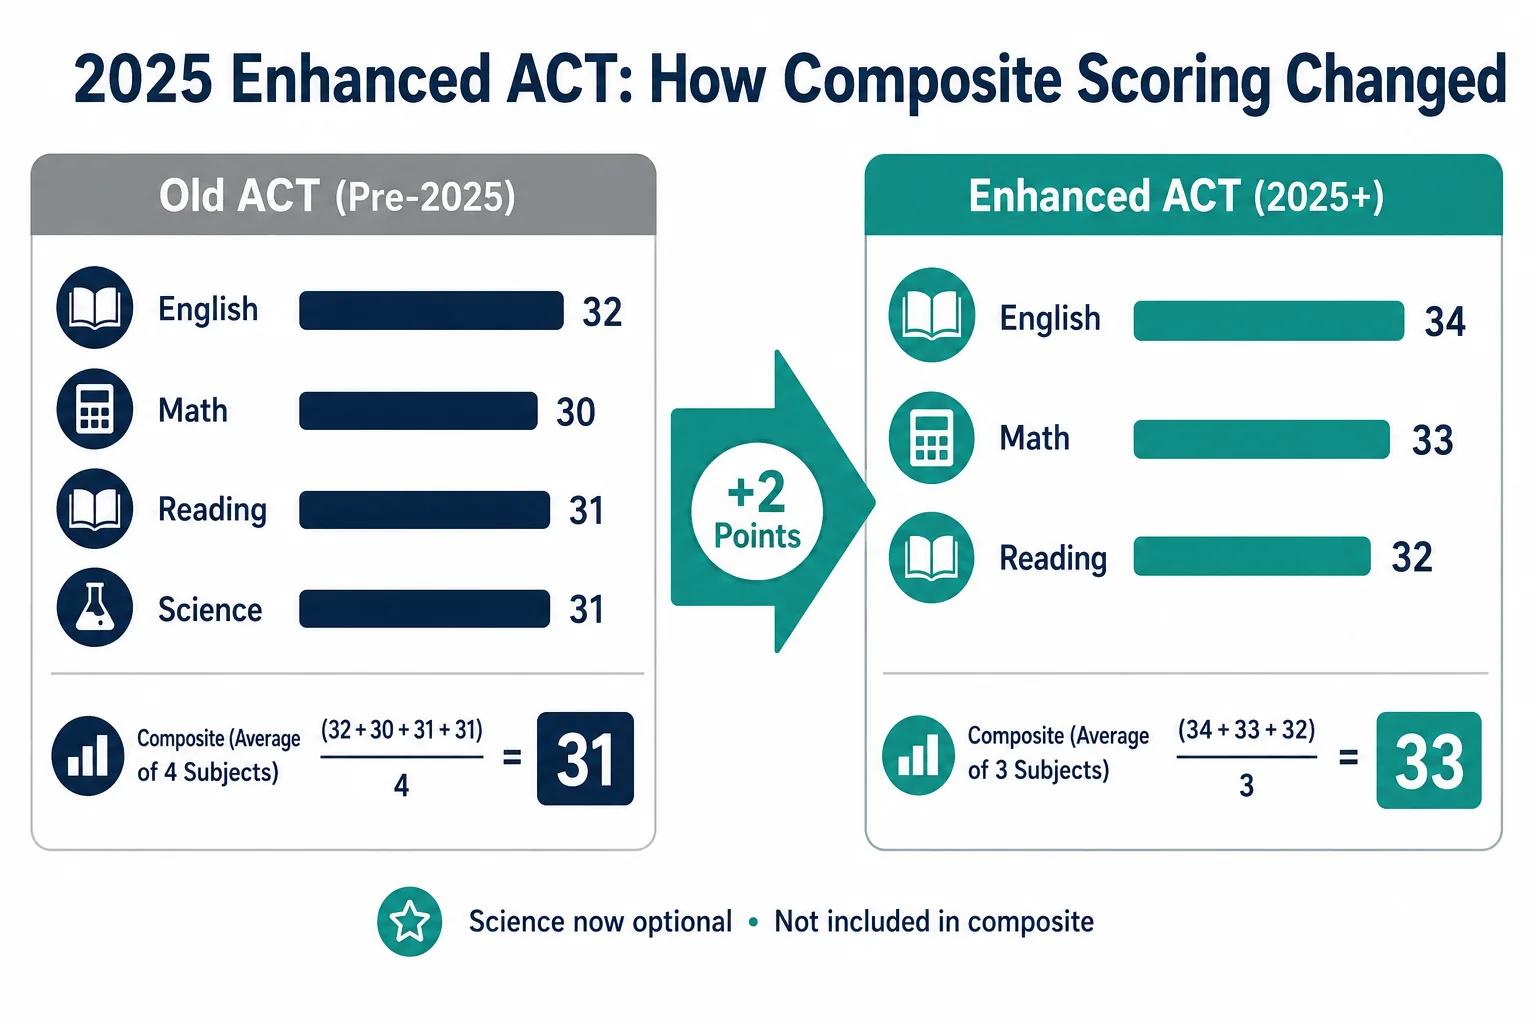
The Enhanced ACT, which rolled out in April 2025 for digital testing and September 2025 for paper tests, changed how the composite score is calculated. Science is now optional. The composite is now the average of English, Math, and Reading only. If you took the ACT before April 2025, your composite included all four sections. If you took it after, Science was excluded from the composite unless you specifically chose to skip it before the format change.
This is a meaningful shift for students whose science scores were dragging down their composite. A student who scored 33 in English, 32 in Math, 33 in Reading, and 26 in Science would have landed with a composite of 31. Under the Enhanced ACT scoring, that same student now scores a 33 composite. That moves them from roughly 1390–1420 on the SAT concordance to 1460–1490.
In tutoring sessions at NAT, we've seen this exact pattern emerge among students who took the ACT under the old format. Their conversion was suppressed by a weaker Science score, even though their verbal and math performance was genuinely strong. The Enhanced ACT corrects for that, and it changes the advice around whether to retake.
ACT Inc. has confirmed that the 2018 concordance tables remain valid for scores under the new composite structure. The math on percentile matching still holds because we compare the underlying English, Math, and Reading performance on the same scale.
If you took the old ACT and a low Science score hurt your composite, it's worth taking the Enhanced ACT. You might find your concorded SAT equivalent shifts by 30–60 points without changing anything else about your preparation. See the chart below for a single point comparison of your SAT score with your ACT score
How do I know which test is better for me?
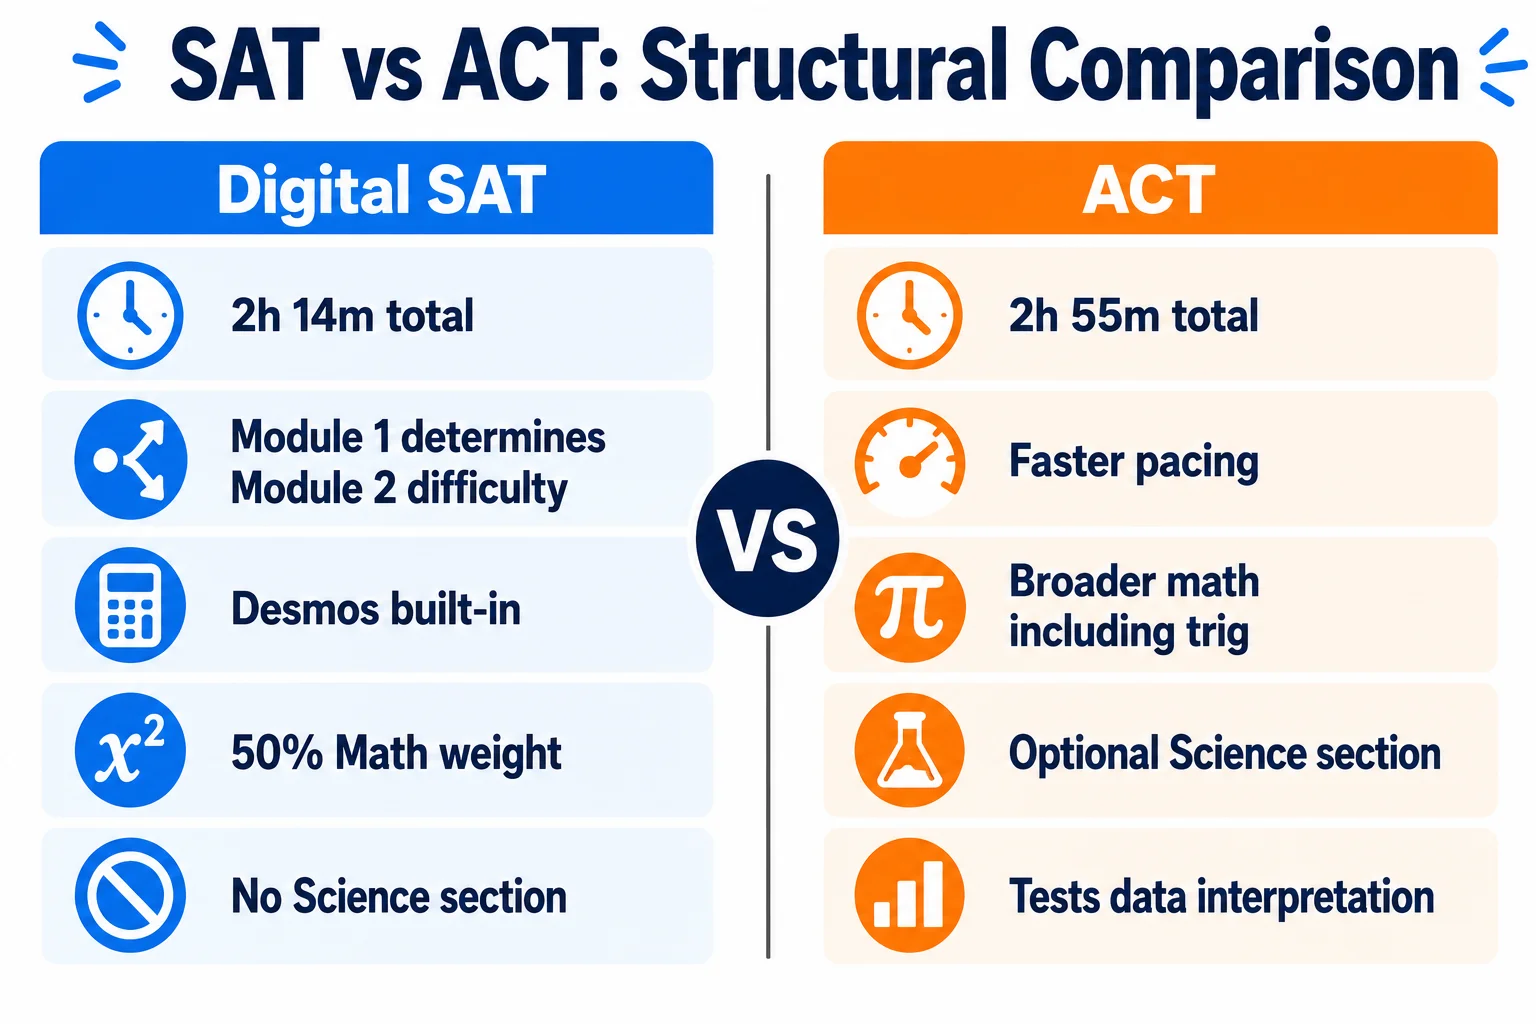
The most reliable way to decide between the SAT and ACT is to take one official full-length practice test for each, then convert the scores using this concordance table. If one score is meaningfully higher (the equivalent of 2+ ACT points or 60+ SAT points), take that test. The test structure becomes the deciding factor when scores are close.
The ACT and the digital SAT test overlap skills in genuinely different ways:
ACT: Faster pacing (more questions per minute), broader math content, including geometry and trigonometry, and an optional science section that tests data interpretation. Students who work quickly and think in patterns tend to do well.
Digital SAT: Adaptive format where a strong first module unlocks harder (higher-scoring) questions in the second. The exam will have a heavier focus on algebra, more time per question, and no science section. Students who reason carefully and have a little more time tend to do well.
Kurtis Lee, an SAT and ACT tutor at North American Tutors, who scored a 36 on the ACT and 1570 on the SAT, puts it this way:
Both tests are accepted equally at all Ivy League and top-tier schools. STEM students often find that the Digital SAT vs ACT choice breaks down differently when math weighting and science reasoning are factors, since SAT Math makes up 50% of the total score while ACT Science tests data interpretation separately.
If you're still deciding, the SAT vs ACT breakdown covers every structural difference in detail, including timing, question formats, and which student profiles tend to score higher on each.
How North American Tutors helps you reach your target score
92% of NAT students improved by at least 90 SAT points or two grade letters after working with one of our tutors. Our tutors come from Harvard, MIT, Stanford, Princeton, Columbia, and other top-tier schools, and they've taken these tests themselves at the highest level.
Whether you scored a 28 on the ACT and want to know if a 31 is realistic, or you're converting a 1380 SAT and wondering if the ACT gives you more room to improve, the strategy is the same: start with a diagnostic, identify your actual gaps, and build prep around those specifically.
We don't run group classes. Every session is one-on-one, and every tutoring plan is tailored to your current level and goals. Book a free strategy session to choose a test, set a realistic score, and plan how to achieve it.
If you're still in the research phase, the test prep blog covers SAT, ACT, AP, and more in the same depth. Students specifically working on the SAT will find free guides, practice tools, and tutor-written breakdowns in the SAT tutoring resource hub, as well as in the ACT resources hub.


