Average SAT score by state: what the class of 2025 data means
"How is an average score a low score?"
That's what a parent in New Mexico asked us after seeing their state's 875 average. Another parent in Nebraska saw 1249 and immediately started drafting a Harvard early-decision essay. Both parents were working from the same misunderstanding, and both were making decisions that could hurt their child's prep.
Average SAT score by state data is everywhere online. Almost nobody explains what it actually means for your child's college chances. State averages are not school report cards. They are snapshots of who took the test, not how good the teaching is or how hard the test was in your zip code.
The Digital SAT launched fully in 2025, making this the first complete digital-cohort dataset. The numbers shifted. The context around them did not. In this guide, you'll see the real 2025 numbers, understand why they swing so wildly from state to state, and leave with a concrete framework to stop comparing your child to a map and start comparing them to their actual goals.
What is the national average SAT score in 2025?
The national average SAT score for the class of 2025 is 1029 out of 1600, according to the College Board's 2025 Total Group Annual Report. Students averaged 521 on the Reading and Writing (ERW) section and 508 on the Math section. These scores come from more than 2 million test takers, the largest cohort since 2020, and the first class to test entirely on the fully digital SAT.
The College Board sets college readiness benchmarks at 480 for Reading and Writing and 530 for Math. Only 39% of the class of 2025 met both benchmarks. That means the majority of SAT test takers have meaningful room to improve, and the national average of 1029 sits well below the threshold most selective colleges use as a floor.
According to the College Board Newsroom, this is the first year since 2020 that the test-taking cohort has crossed two million students. More students taking the test tends to pull the national average down, because a larger pool includes more students who are still developing their skills.
What is the average SAT score by state for the class of 2025?
State SAT averages follow a clear pattern: the more students required to take the test, the lower the average. The less required, the higher. Understanding that pattern is the only way to read a state table honestly.
The table below shows the full picture for the class of 2025. The participation rate column is the one that matters most.
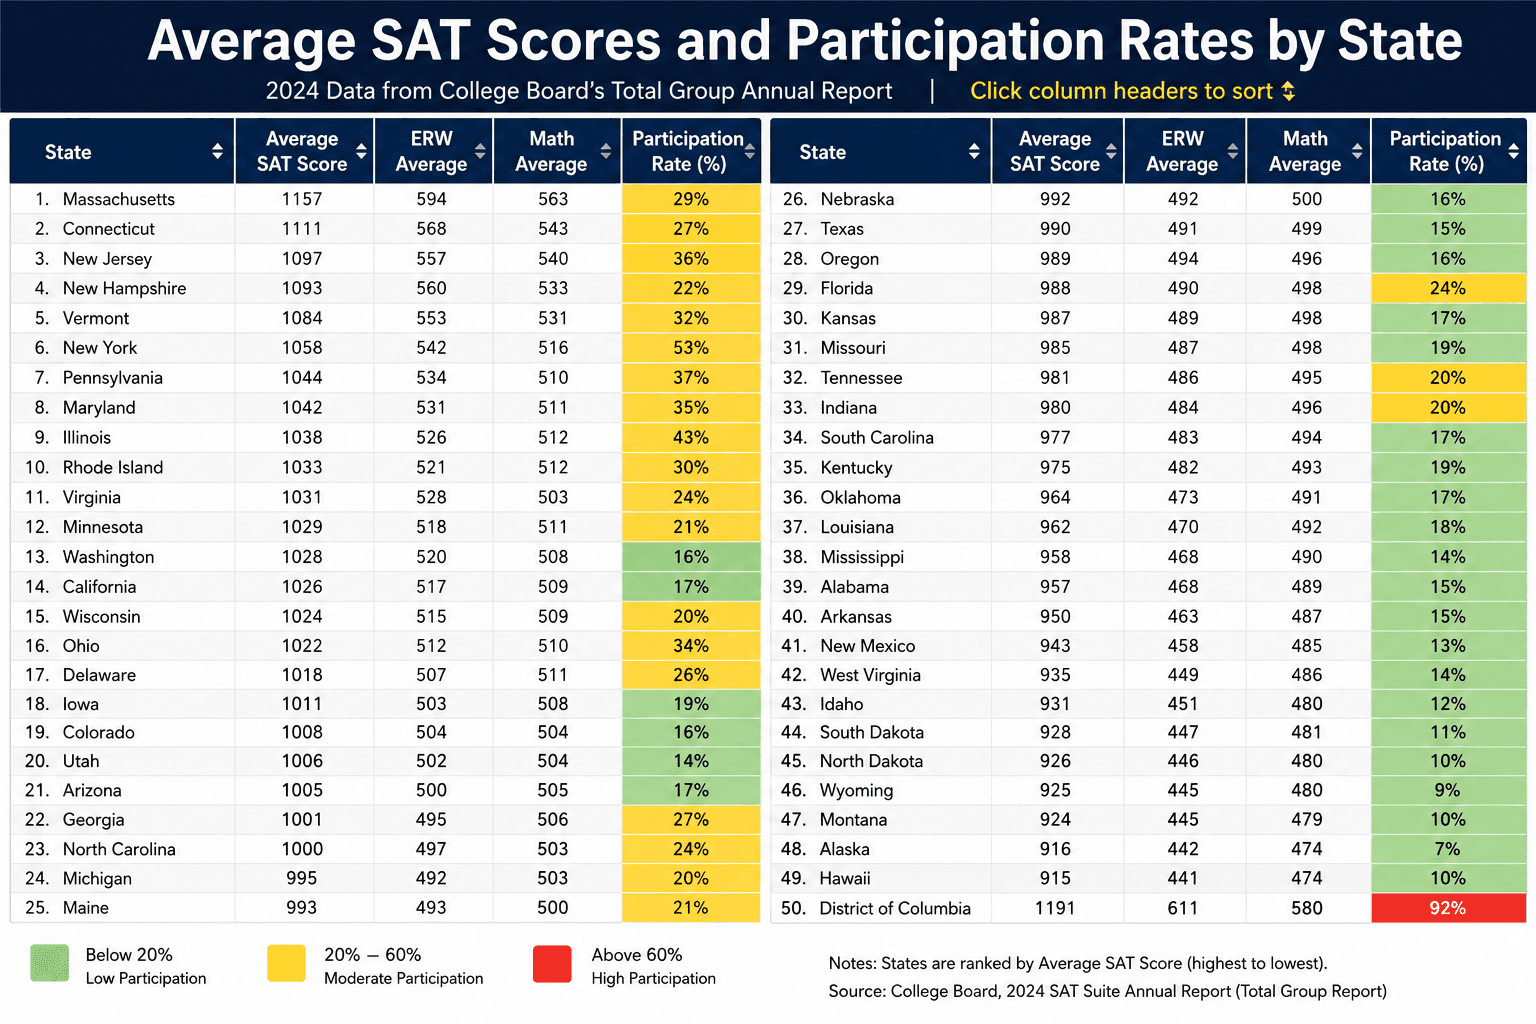
Source data from Scholarships360 and Progress Learning.
States with the highest average SAT scores
The five states with the highest 2025 SAT averages all share one trait: very low participation.
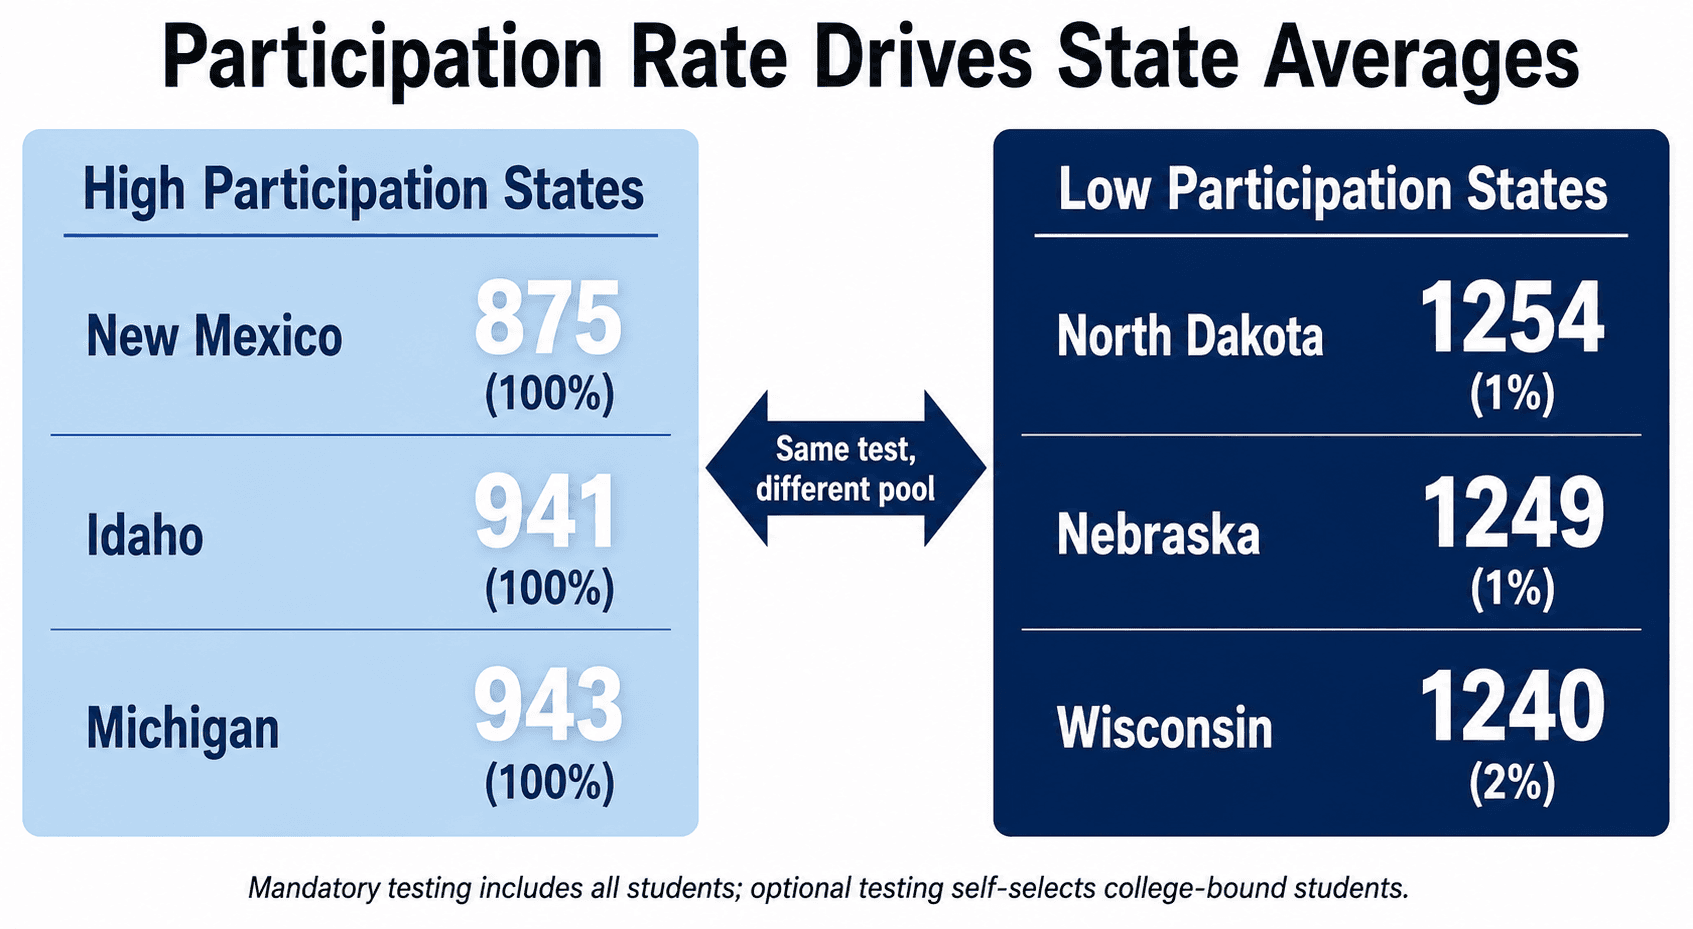
North Dakota — 1254 average, 1% participation
Nebraska — 1249 average, 1% participation
Wisconsin — 1240 average, 2% participation
Iowa — 1235 average, 3% participation
Minnesota — 1230 average, 4% participation
In these states, only students who specifically chose to take the SAT (typically those applying to out-of-state colleges) show up in the data. The pool is self-selected and college-bound, which pushes the average up significantly.
States with the lowest average SAT scores
The five states with the lowest averages all require every junior to take the SAT as part of mandatory statewide testing.
New Mexico — 875 average, 100% participation
West Virginia — 911 average, 93% participation
Delaware — 933 average, 94% participation
Idaho — 941 average, 100% participation
Michigan — 943 average, 100% participation
A student scoring 950 in Michigan is competing against every single junior in the state. A student scoring 950 in North Dakota is competing against the most academically motivated 1% of juniors. Same score, completely different context. That's the participation-rate trap, and it catches families every year.
Which state has the highest average SAT score?
North Dakota has the highest average SAT score for the class of 2025, at 1254, but only 1% of students in the state took the test. Nebraska follows at 1249 with 1% participation, and Wisconsin averages 1240 with 2% participation. These high averages reflect a self-selected group of college-bound students, not overall state academic strength. They are not benchmarks any student should compare themselves against without accounting for that participation gap.
Which state has the lowest average SAT score?
New Mexico has the lowest average SAT score for the class of 2025, at 875, with 100% of students required to take the test. West Virginia averages 911 with 93% participation, and Delaware averages 933 with 94% participation. These low averages reflect mandatory statewide testing that includes every student, not just college-bound ones. A low state average in a high-participation state says nothing about the quality of its teachers or the ability of its students.
How is an average score a low score? Understanding state SAT averages
Here's what actually trips families up: the same state average can be both "impressive" and "misleading" depending on which direction you're coming from.
A parent in North Dakota sees 1254 and thinks their child is already ahead. A parent in New Mexico sees 875 and panics that their state is failing. Neither reaction is grounded in what the data actually shows. Both reactions lead to bad decisions about prep strategy.
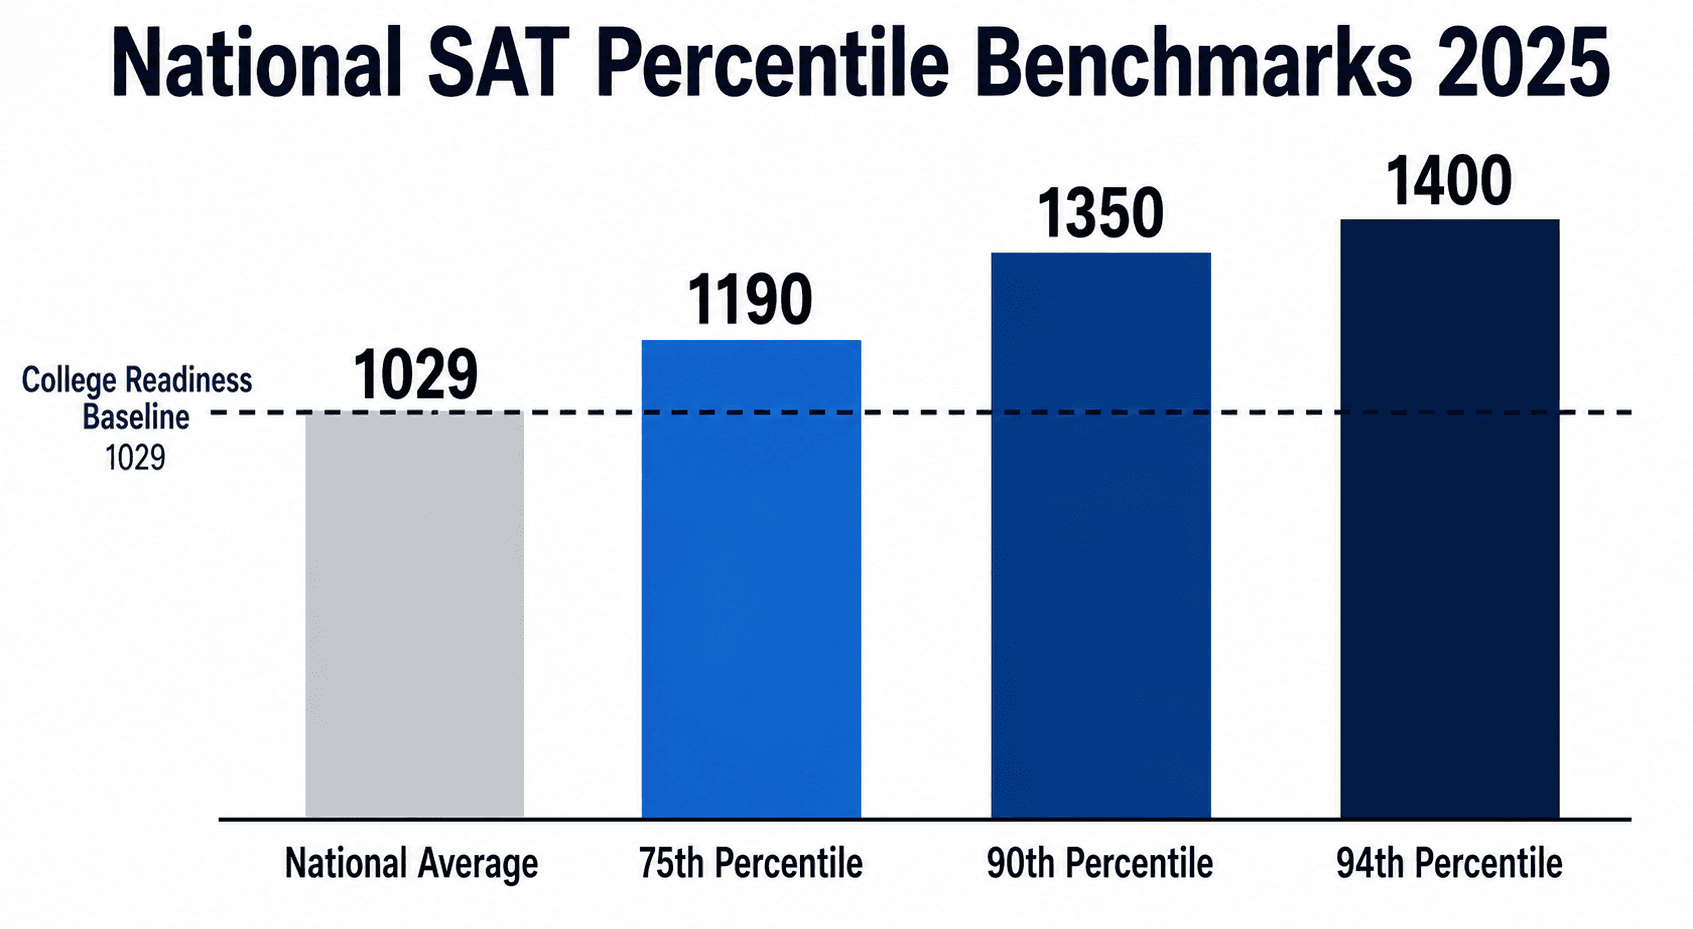
Magoosh's 2025 percentile data puts a 1350 at the top 10% nationally. BestColleges reports that a score of 1190 sits at the 75th national percentile, and a 1020 sits at approximately the 51st. Those national percentiles are the number that matters for college admissions, not where your child sits relative to their state.
The second trap is what we call the "color-coded map" problem. Online maps rank states by SAT average using colors from red to green. Students and parents read these maps as judgments about academic quality. They aren't. They're maps of testing policy. A green state (high average) likely has low participation. A red state (low average) likely has a mandatory testing policy. Reading the map as a quality signal leads families to either over-relax or over-panic, and both outcomes cost prep time.
I scored above my state average. Why did I get rejected?
This is one of the most common questions parents bring to NAT consultations. The short answer: state averages and college admissions benchmarks are measuring completely different things.
Here is the three-question framework NAT tutors use to decode any state average and translate it into an actionable prep target.
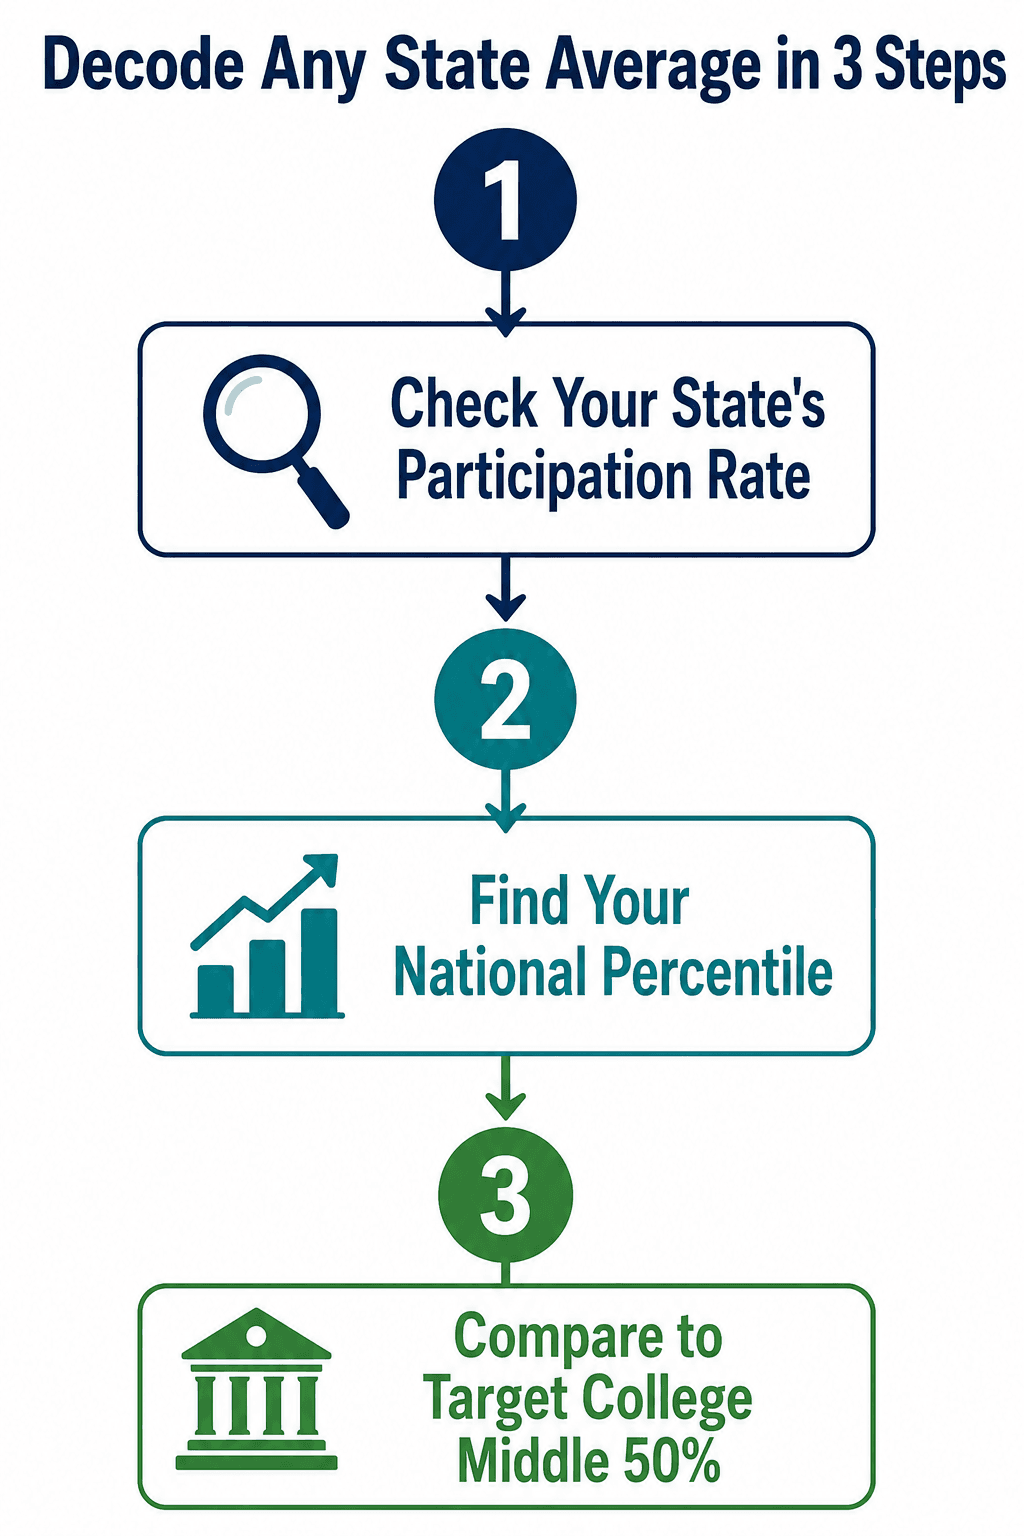
Question 1: What is your state's participation rate?
If your state has low participation (under 20%), your state average is inflated. A score that looks average in your state may actually be below the national median. Check your state's participation rate alongside the average, not just the number itself. Progress Learning's state table includes participation rates for all 50 states.
Question 2: What is your score's national percentile?
This is the only comparison that transfers cleanly to admissions. A score of 1100 is in roughly the 58th national percentile. A 1200 is around the 74th. A 1400 clears the 94th. BestColleges' full percentile chart maps every score range to its national standing. Use that, not your state average, to understand where your child actually sits.
Question 3: What is your target college's middle 50% range?
The middle 50% (or interquartile range) shows the scores that the 25th and 75th percentiles of admitted students earned. A student scoring below the 25th percentile of a school's admitted class faces a real statistical headwind. A student scoring above the 75th percentile has cleared the SAT bar entirely. Empowerly's guide includes the middle-50 context alongside the state data.
If your child scored above their state average but below a target school's middle-50 floor, the state comparison was never the relevant one.
Many students and parents bring these questions to our SAT tutor, Brian M. He explains this to our team during a one-to-one session with an SAT student:
How can you raise your SAT score above the national average?
Most students who score below 1029 are not lacking ability. They're missing a diagnostic that tells them exactly which skills are holding their score down.
Step 1: Run a real diagnostic before you prep.
The College Board's free Bluebook app simulates the actual digital SAT interface and generates a score report showing your performance by skill category. That report tells you whether your score loss is concentrated in SAT Reading and Writing or in SAT Math, and within each section, which question types are costing you the most points.
Step 2: Target your sections, not the whole test.
A student scoring 480 on Math and 550 on Reading and Writing should not split their prep time evenly. Their Math section is below the College Board's college readiness benchmark of 530, and that's where the fastest gains live. Students who target their actual weak section first typically see faster overall improvement than students who do general practice across both.
Use your PSAT results as an early diagnostic if you have them. PSAT scores predict SAT ranges with reasonable accuracy and give you a head start on identifying where to focus.
Step 3: Build a practice test rhythm.
One full-length practice test per week, reviewed thoroughly, outperforms five partial sessions done inconsistently. Our guide on how many SAT practice tests you actually need breaks down the optimal cadence by prep timeline and target score.
If you're also weighing whether to sit the ACT instead, see our SAT to ACT conversion chart to understand how your current SAT performance maps to an ACT equivalent.
The bottom line
State SAT averages are an interesting context. They are not a college admissions compass.
The number that predicts your child's admissions competitiveness is their national percentile relative to the middle-50 range of their target schools, not whether they scored above or below their state average. A student in New Mexico scoring 1050 is performing well above the national median in a state where every junior tests. A student in Nebraska scoring 1050 may be performing below the typical profile of their state's college-bound cohort. Same number, opposite implications.
Use the three-question framework: check your state's participation rate, find your national percentile, and compare it to your target school's middle-50. That's the only version of this data that translates into a prep target.
If you want to know exactly where your child stands and what it would take to hit the score their target schools expect, book a free consultation with NAT. Our tutors run this diagnostic in the first session. Your grades are now our responsibility.
Explore one-on-one SAT tutoring with NAT tutors from Harvard, Stanford, Brown, and other top universities.


