What is the average SAT score?
You get the score report back. It says 1029. You Google "average SAT score" and land on that same number. So is this good? Is your child in trouble? Can they still get into a real college?
Here's the honest answer: the average SAT score tells you where 2 million test-takers landed. It tells you almost nothing about your child's specific college chances. A 980 might be competitive for their list. A 1200 might not be enough for their dream school. Context is what turns numbers into something useful.
At North American Tutors, we've worked with students across every score level since the shift to digital adaptive testing. This guide covers the 2026 average SAT score landscape with data from the College Board, real student outcomes, and a step-by-step framework for figuring out exactly where your child needs to be.
What is the average SAT score in 2026?
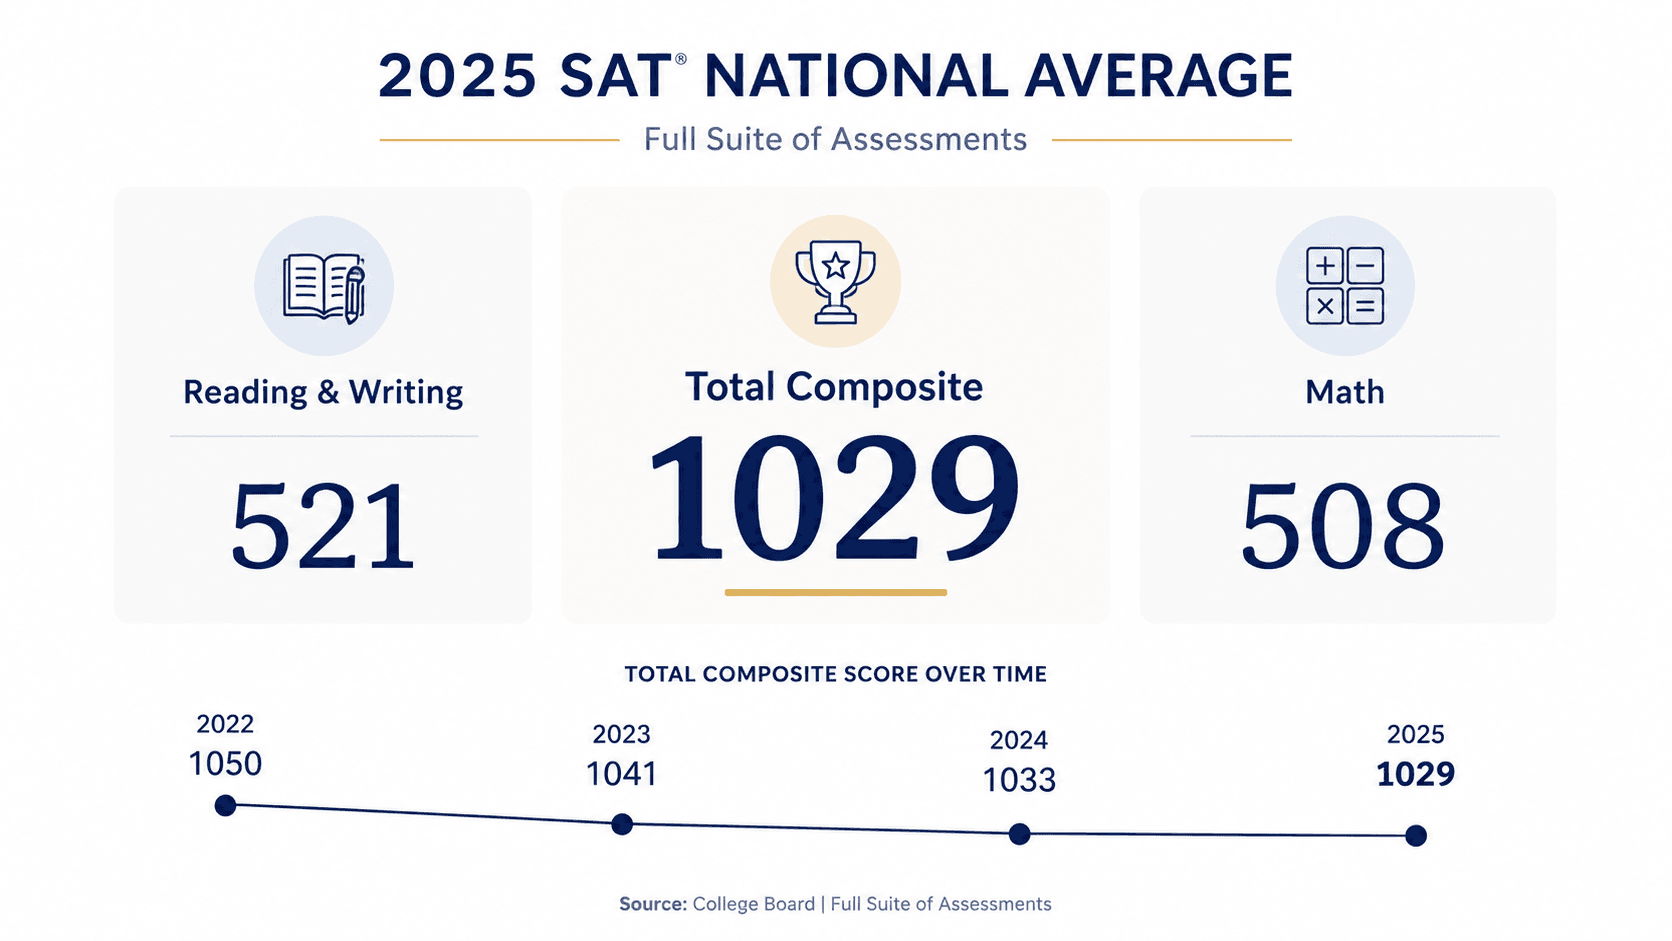
The most recent College Board data from the 2025 graduating cohort shows these national averages:
Section | Average Score |
|---|---|
Total (Composite) | 1029 |
Reading and Writing | 521 |
Math | 508 |
These figures represent all students who tested in that cycle. More than 2 million students took the SAT in 2025, the highest participation since 2020. A score of 1029 sits exactly at the 50th percentile nationally.
Here's how the average has shifted over the past four years:
Year | Total | Reading and Writing | Math |
|---|---|---|---|
2022 | 1050 | 529 | 521 |
2023 | 1028 | 520 | 508 |
2024 | 1024 | 519 | 505 |
2025 | 1029 | 521 | 508 |
The 2025 uptick to 1029 suggests scores are stabilizing after the full transition to the digital adaptive SAT format in 2024.
Alexander J., a 1600 SAT tutor and medical student at Brown University, explains what he sees in first sessions with students targeting 1400 and above:
For students starting near the national average, 92% of NAT students improved by at least 90 SAT points. Moving from 1029 to the 1150 to 1300 range is a realistic outcome with targeted one-on-one prep.
Why the digital adaptive SAT changed what "average" means
Since March 2024, the SAT has been fully digital and section-adaptive. This isn't just a format change. It fundamentally affects how score distributions work and why some students feel stuck despite studying hard.
Here's how it works: each section has two modules. Your child's performance on Module 1 determines whether they get the harder or easier Module 2. Students routed to the lower second module have their maximum possible section score capped at approximately 620 to 630, even if they answer every remaining question correctly.
What this means in practice: a student scoring 600 to 650 on a section may have been routed to the lower module based on early pacing or a cluster of errors in Module 1. This isn't an ability problem. It's a strategy problem, and it's fixable.
Mastering the built-in Desmos calculator helps students move through Module 1 Math questions faster and with fewer errors, which directly affects module routing. Our free SAT Desmos cheat sheet covers the essential shortcuts.
For a deeper dive, our guide on SAT Desmos calculator tips walks through the five functions every student needs to know before test day.
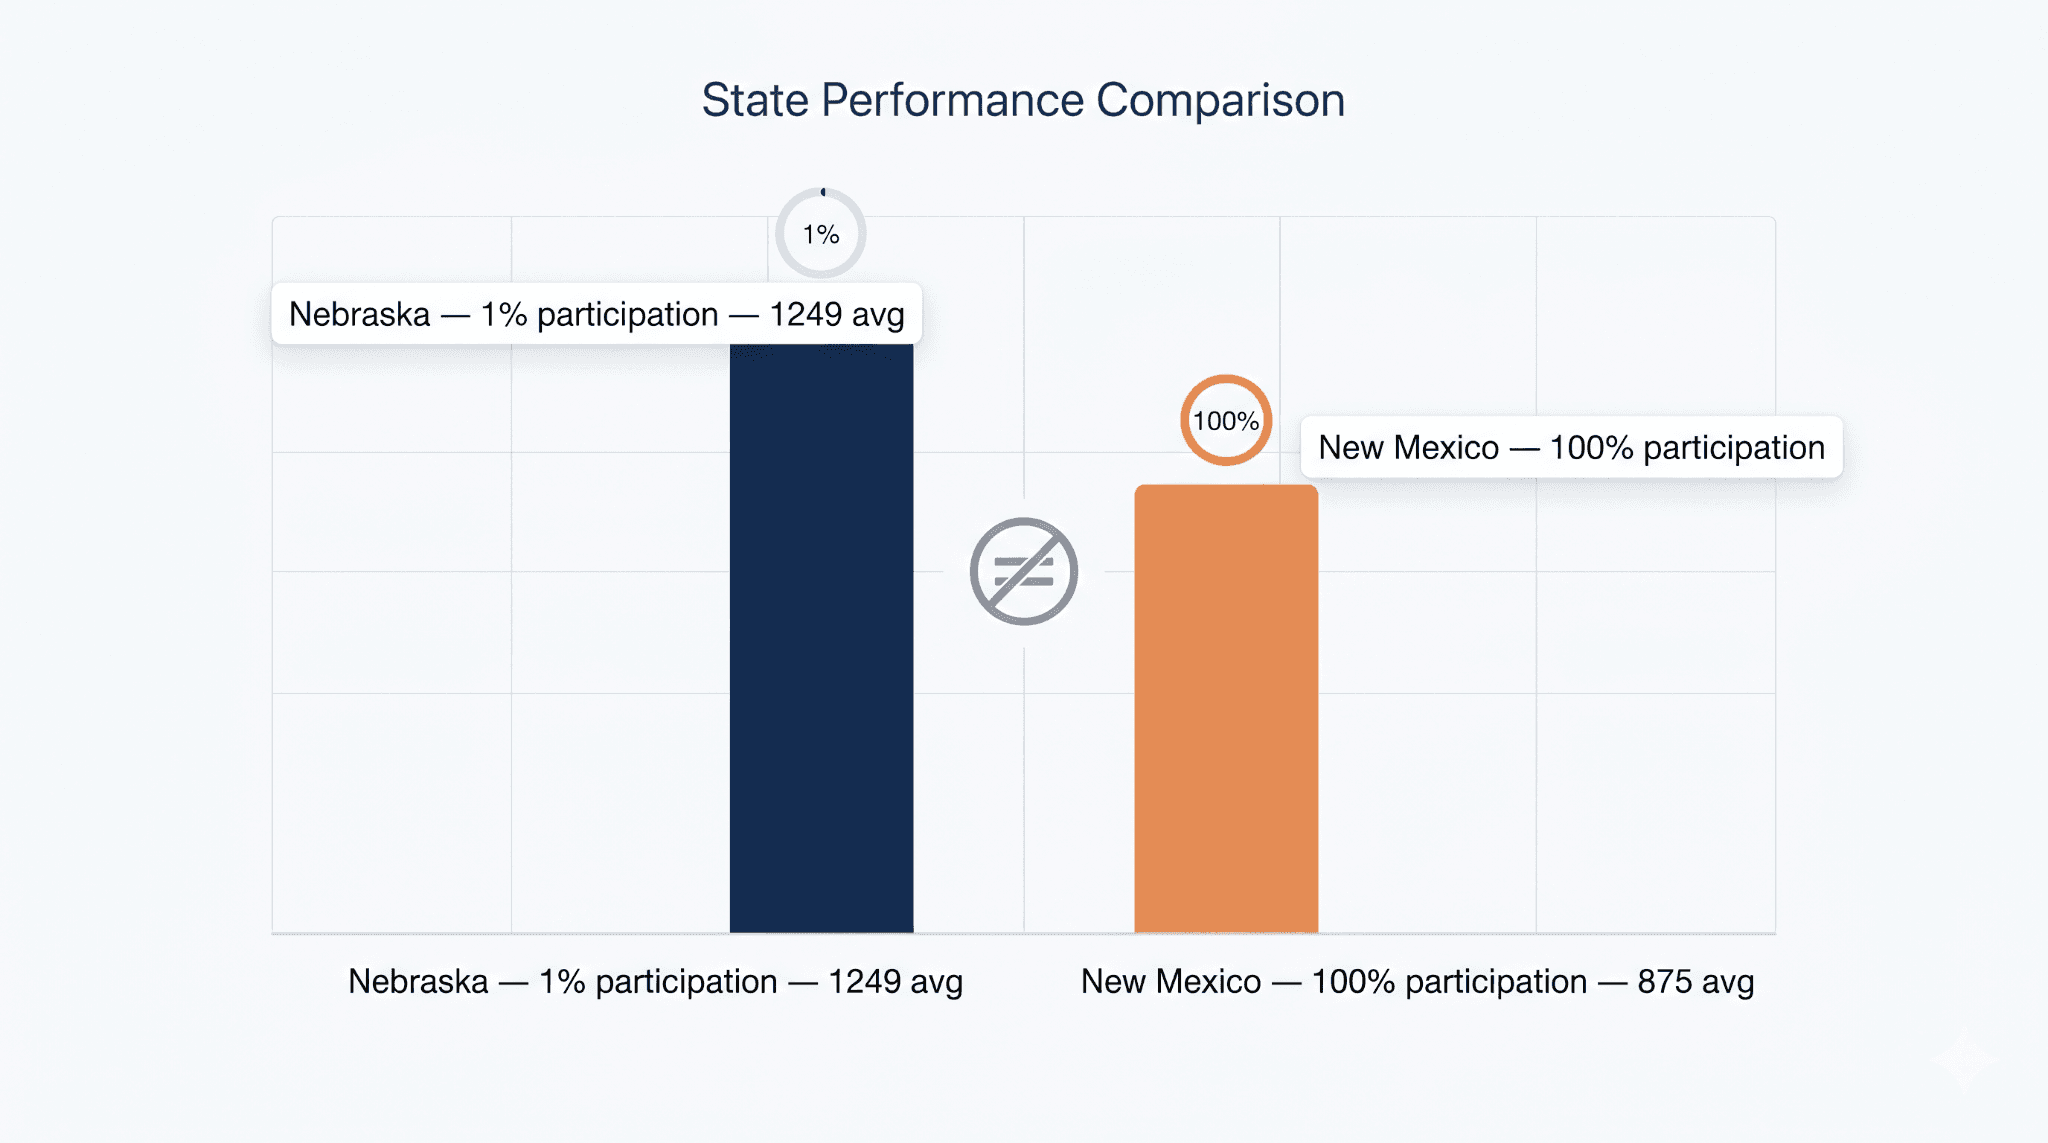
Average SAT score by state: the participation rate paradox
State averages vary from 875 in New Mexico to 1249 in Nebraska. But these numbers are almost meaningless without understanding participation rates, according to Scholarships360's 2025 state breakdown.
State | Participation Rate | Average Score |
|---|---|---|
Nebraska | 1% | 1249 |
Wisconsin | 2% | 1240 |
Indiana | 100% | 950 |
New Mexico | 100% | 875 |
National Average | n/a | 1029 |
States with 1 to 3% participation typically have only self-selected, highly motivated students who are testing. States with 100% participation test every junior during school hours, capturing the full academic spectrum. The result is an apples-to-oranges comparison that misleads more families than it helps.
If your child lives in a high-participation state like Indiana, Illinois, or Michigan, their score may fall below the state average and still be well-positioned for their specific college list. The state average tells you almost nothing useful about individual college readiness.
What is a good SAT score for college admissions?
A good SAT score meets or exceeds the 25th percentile of admitted students at your child's target schools. According to College Board guidance on score meaning, students should aim for the upper end of the middle 50% range at schools where they want to be competitive.
Here's a fast percentile reference:
Score Range | Percentile | What It Means |
|---|---|---|
1350 and above | 90th | Top 10%, competitive for selective schools |
1200 to 1340 | 75th to 89th | Above average, strong for most public universities |
1029 | 50th | National average |
900 to 1010 | 25th to 49th | Below average, viable at many test-optional schools |
Below 900 | Bottom 25% | Test-optional route worth considering |
And by college tier:
College Type | Typical Mid-50% SAT Range |
|---|---|
Community colleges and open-enrollment | 800 to 1050 |
Most regional public universities | 1050 to 1250 |
Competitive state flagships | 1200 to 1380 |
Selective private universities | 1350 to 1500 |
Ivy League and top-tier schools | 1500 to 1580 |
For families targeting the Ivy League specifically, our detailed guide on Ivy League SAT requirements breaks down the middle-50% ranges for each school and what submission actually signals at those institutions.
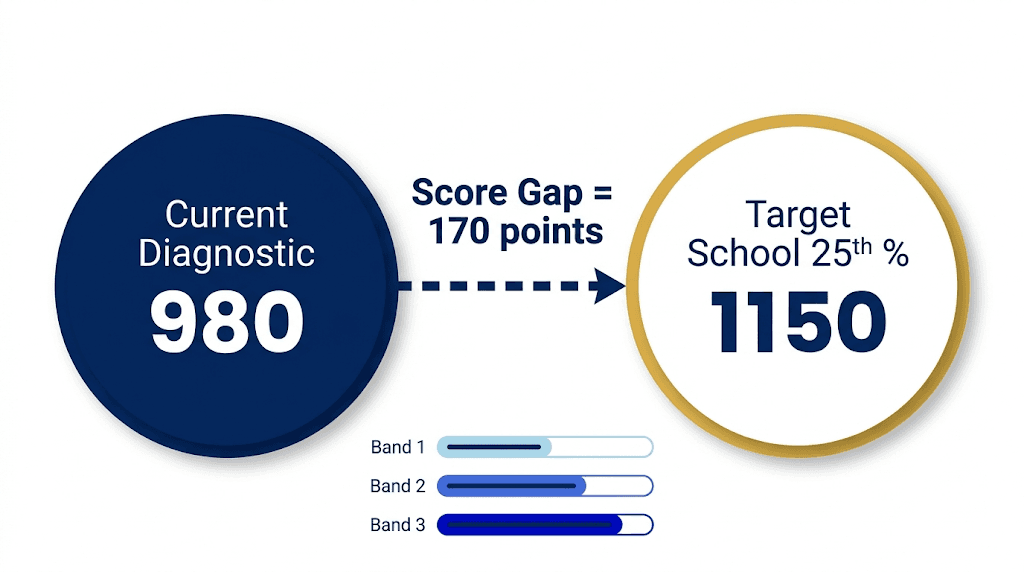
The Score Gap Framework: how NAT tutors set the real target
The national average SAT score of 1029 shows where 2 million test-takers landed. It doesn't show where your child needs to land. NAT tutors use a different starting point: the Score Gap, which is the distance between a student's current diagnostic score and their target school's 25th percentile admitted score. That gap, not the national average, drives every prep decision we make.
The Score Gap formula:
Score Gap = Target School's 25th Percentile Admitted Score minus Your Child's Current Diagnostic Score
Here's what that looks like across three real score bands:
Band 1: 980 diagnostic, targeting a state flagship (25th percentile: 1150) The Score Gap is 170 points. Prep at this level focuses on foundational section skills: closing the "sounds-right trap" in Reading, tightening algebra and data analysis in Math, and building consistent timing across both modules. A structured plan closes this gap in 3 to 4 months of focused one-on-one sessions.
Band 2: 1150 diagnostic, targeting a competitive private school (25th percentile: 1300) The Score Gap is 150 points. Foundational skills are mostly in place. Prep shifts to precision work: stronger inference reading, advanced algebra setups, and careless error reduction. This is a 2 to 3 month plan with heavy emphasis on full-length adaptive practice under real conditions.
Band 3: 1280 diagnostic, targeting a selective university (25th percentile: 1450) The Score Gap is 170 points. This range requires mastering the top 10 to 15% of question difficulty in both sections. Reading precision on evidence-support questions, Math fluency on advanced function and geometry problems, and module routing strategy all become critical. Two to three months with session-level diagnosis of specific question types, not general practice.
Wanning L., a 1570 SAT scorer tutoring students across all score levels, explains what changes when students see their real number:
My child scored exactly average. What should we do now?
A score of 1020 to 1040 places your child at the 50th percentile nationally. It's not a bad result. But it's not a finish line either. What you do next depends entirely on their college list and financial goals.
Scenario | Recommendation |
|---|---|
Targeting test-optional schools | Only submit the SAT if it's at or above the school's middle 50%. Invest prep time in GPA and essays. Consider how extracurriculars factor into admissions for test-optional review. |
Targeting test-required public universities | A score of 1020 to 1050 is competitive at many broad-access public colleges. Check the specific school's middle 50% before deciding to retake. |
Aiming for merit scholarships | Retake if possible. A 100-point improvement to 1120 to 1140 can unlock thousands in automatic aid at many state universities. |
Scoring below 1000 with a strong GPA | Consider the test-optional route at applicable schools. If scores are required, 6 to 8 weeks of targeted prep can typically yield 150 to 200 points of improvement. |
Real student outcome: Eli A. came to NAT with a 1360 and a target school requiring closer to 1500. Working with NAT tutors on structured session planning and error-level diagnosis, he scored a 1510 on his official SAT in 3 months, a 150-point gain that met his Score Gap nearly exactly.
Planning a retake? Our guide on how many SAT practice tests you really need breaks down the optimal testing timeline by score band and target. Most students need 4 to 6 full-length adaptive tests built into a structured plan, not just stacked at the end.
Average SAT scores by gender and ethnicity (2025 data)
Understanding how scores vary by group can help contextualize where your child's score fits:
By Gender
Gender | Total | Reading and Writing | Math |
|---|---|---|---|
Male | 1035 | 520 | 515 |
Female | 1021 | 522 | 500 |
By Race and Ethnicity
Group | Total | Reading and Writing | Math |
|---|---|---|---|
Asian | 1229 | 599 | 630 |
White | 1077 | 550 | 527 |
Two or More Races | 1073 | 550 | 524 |
Hispanic or Latino | 928 | 474 | 454 |
Black or African American | 904 | 464 | 440 |
These demographic averages reflect documented educational inequities, not individual potential. According to the NACAC State of College Admission report, colleges using holistic review specifically account for these disparities when evaluating applications. A student scoring below their demographic average who shows a strong GPA trajectory and meaningful extracurricular commitment can still be highly competitive.
How to improve your child's SAT score from average to competitive
Improvement starts with a full-length diagnostic, not a short quiz or a practice section. A complete adaptive test taken through College Board's Bluebook app gives you actual section scores, module routing data, and a question-level breakdown that shows exactly where points are being lost. Prepping without a diagnostic is guesswork.
Once you have a diagnosis, the path forward depends on the Score Gap:
Gap of 150 points or more: Section-level work comes first. Identify which section is dragging the composite down and target it specifically. Most students at this gap have 2 to 3 question types in their weaker section that account for the majority of errors.
Gap of 80 to 150 points: Foundational skills are mostly in place. Focus on full-length tests with post-session error analysis, reviewing why each wrong answer was chosen rather than just confirming the right one. This approach reveals process errors that generic practice misses entirely.
Gap under 80 points: Precision work. The gains at this level come from the hardest 10 to 15% of questions. Generic practice won't make a difference. Documented weak question types will be drilled under timed conditions.
For students unsure whether the SAT or ACT is the right test for them, our SAT vs ACT guide walks through the differences section by section, and our ACT to SAT conversion chart helps families compare where a student stands on both scales.
Our SAT tutoring resource hub also has free formula sheets, Desmos shortcuts, and success stories from students who closed their Score Gap.

The average SAT score is a starting point, not a verdict
The national average of 1029 tells you where the country lands. It doesn't tell you whether your child is on track for their specific schools, whether they should retake, or how much prep will actually move their score. Those answers come from the Score Gap, not the national number.
If your child is below average, they have more options than it feels like right now. If they're above average, that's a solid starting point, but it may not be enough depending on their college list. The students who improve fastest are the ones who stop comparing themselves to the national benchmark and start working toward their actual target.
Our SAT tutoring program specializes in digital SAT strategy for every score level, from students rebuilding a 950 to students pushing a 1450 toward 1550. 92% of our students improve by at least 90 SAT points. Your grades are now our responsibility.
Book a free consultation, and we'll map your child's Score Gap and build a session plan around their actual college list.


